Knowing how to visualize your metrics makes all the difference in the world of data-driven decisions. That’s where Google Data Studio comes in—a free and powerful Google tool that converts raw data into interactive dashboards and reports that can be changed. What can you do to get the most out of it, then? This guide will teach you everything you need to know about using Data Studio Google to its full potential, whether you are a marketer, small business owner, or data analyst.
What Exactly Is Google Data Studio?
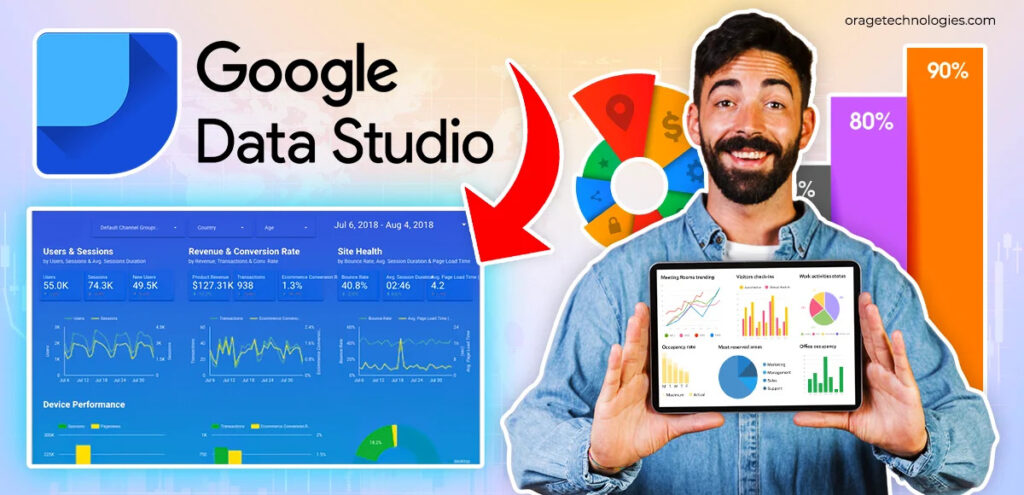
You can use Google Data Studio, a free dashboard and reporting tool, to turn data into reports that are useful, simple to read, and customizable. In a single report, you can get data from BigQuery, Google Ads, Google Sheets, Google Analytics, and other places. Unlike spreadsheets, which can be overwhelming and static, Data Studio makes it easier to interact with your metrics. Date ranges, filters, and even viewer-level access controls can all be used.
Why Should You Use Google Data Studio?
Good question! Here’s why it’s a must-have in your digital toolbox:
- Free to use: Unlike most BI tools, it’s completely free.
- Real-time data: Automatically pulls live data from connected sources.
- Custom dashboards: Create visually appealing dashboards tailored to your needs.
- Easy sharing: Just like a Google Doc, share your dashboard with teammates or clients.
- Interactive elements: Filters, dropdowns, and clickable charts make reports dynamic.
Whether you’re running weekly marketing campaigns or tracking monthly sales, Google Data can drastically reduce reporting time and improve team clarity.
How Do You Get Started with Data Studio Google?
Getting started is surprisingly simple. Follow these steps:
- Visit datastudio.google.com and sign in with your Google account.
- Click “Blank Report” to start fresh or choose from a template.
- Connect your data source (like Google Analytics or Sheets).
- Start dragging and dropping charts, scorecards, and filters.
Within minutes, you can have a dashboard that looks professional and serves real business insights.
What Are the Most Common Data Sources Used in Google Data Studio?
You’re not limited to just one tool. You can connect multiple sources at once. Popular connectors include:
- Google Analytics
- Google Ads
- Google Sheets
- BigQuery
- YouTube Analytics
- Facebook Ads (via third-party connectors)
- MySQL databases
- CSV uploads
So, for example, if you’re running a paid ad campaign and tracking traffic in Analytics, you can show both in one place—no toggling between platforms.
How Can You Make Your Dashboard Truly Useful?
A pretty dashboard is nice, but a useful one drives action. Here’s how:
1. Define Your KPIs (Key Performance Indicators)
Start with your goals. Are you tracking leads, page views, revenue, or bounce rate? Know what matters and design your dashboard around those.
2. Use Filters and Date Ranges
Give users control. With filters, they can choose specific campaigns or landing pages. A dynamic date selector allows them to see performance trends over time.
3. Stick to a Clean Layout
Avoid clutter. Use whitespace, consistent colors, and clear labels. A good dashboard tells a story at a glance.
4. Use Scorecards and Time Series
Use scorecards for totals (like total users), and line charts for trends. Pie charts? Only when comparing a few categories.
What Are Some Best Practices for Sharing Google Data Studio Reports?
Collaboration is key. Here’s how to make your reports easier to share:
- Use viewer-level filters so different users can see only their data.
- Schedule email deliveries (weekly/monthly updates).
- Control access levels: Viewer vs Editor.
- Use page navigation menus for multi-page reports.
And yes, you can embed your dashboard into websites or intranets too.
Can You Use Google Data Studio for SEO or Marketing Campaigns?
Absolutely. It’s one of the top uses. Combine Google Search Console, Analytics, and Ads to see the full picture of your funnel. You can track:
- Organic vs Paid traffic
- Bounce rate by channel
- Top-performing pages
- Keyword positions (via Search Console)
- Budget vs ROI for paid ads
With Data Studio, marketers can finally say goodbye to Excel hell.
How Does Google Data Studio Compare with Other Tools Like Tableau or Power BI?
Here’s a quick comparison:
| Feature | Google Data Studio | Tableau | Power BI |
| Cost | Free | Paid | Free & Paid |
| Learning Curve | Easy | Moderate | Moderate |
| Data Sources | Good (needs connectors for 3rd party) | Excellent | Excellent |
| Sharing | Seamless | Secure but complex | Good |
If you want a powerful, no-cost dashboarding tool and are already using Google products, Google Data is your best bet.
Frequently Asked Questions (FAQs)
Q1: Is Google Data Studio free?
Yes! All core features are completely free. You might pay for third-party connectors, but the tool itself costs nothing.
Q2: Can I create dashboards without coding?
Absolutely. Everything is drag-and-drop. If you can use PowerPoint or Excel, you can use Google Data.
Q3: How do I connect a Google Sheet to Data Studio?
Simply choose Google Sheets as your data source, select the specific spreadsheet and tab, and you’re connected.
Q4: How often is the data refreshed?
That depends on the source. Google Analytics and Ads update in near real-time. Sheets can take a few minutes to reflect changes.
Q5: Can I use Data Studio Google on mobile?
You can view reports on mobile, but editing is best done on a desktop.
Final Thoughts: Is Google Data Studio Worth Your Time?
Yes, a hundred times, yes. If you’re drowning in spreadsheets or wasting hours on weekly reports, it’s time to move to Google Data Studio. It’s not just a tool—it’s a productivity boost, a time-saver, and a decision-making companion.
With minimal setup and maximum benefit, you’ll wonder how you ever managed reporting without it.