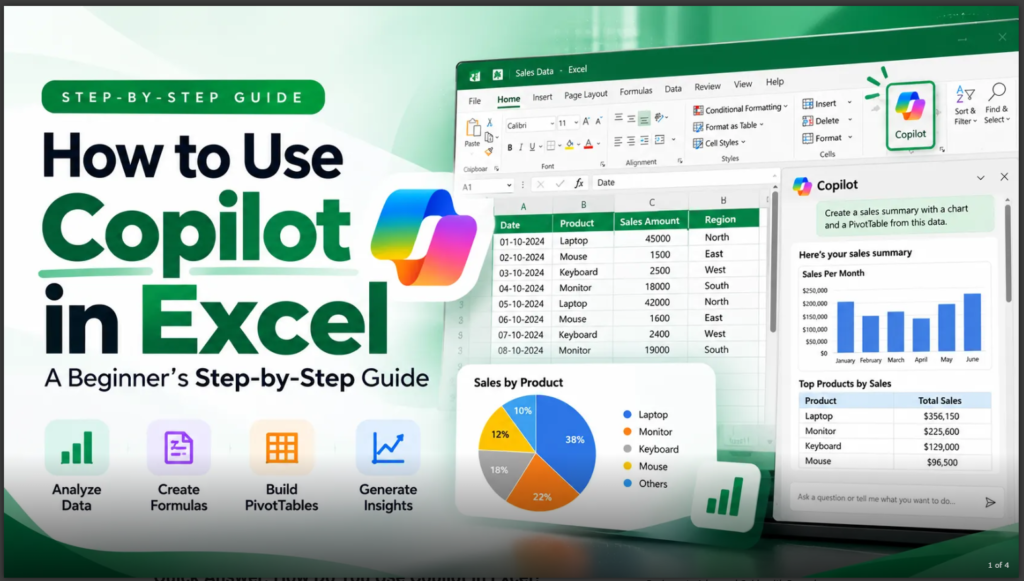
Excel is one of the most useful tools for organizing information, managing budgets, tracking sales, and analyzing business performance. But for beginners, formulas, PivotTables, charts, and complicated worksheets can quickly become overwhelming. What if you could describe what you want in everyday language instead of memorizing dozens of Excel functions?
That is where Microsoft Copilot in Excel can help.
Copilot brings AI assistance into spreadsheet workflows, allowing eligible users to ask questions about data, generate formulas, build charts, summarize information, and make workbook edits through natural-language prompts. Rather than performing every step manually, you can explain your goal and review the suggested results before using them.
In this complete guide, you will learn how to use Copilot in Excel, prepare your spreadsheet, write effective prompts, analyze data, create reports, troubleshoot common problems, and avoid mistakes. Whether you are a student, office professional, small-business owner, or first-time Excel user, this practical walkthrough will help you understand where AI can make spreadsheet work easier.
Read the complete guide to discover how to turn everyday spreadsheet tasks into a more organized, efficient, and understandable workflow.
What Is Copilot in Excel?
Microsoft Copilot in Excel is an AI-powered assistant that helps users create, understand, analyze, and edit spreadsheets using natural-language instructions. Instead of navigating every menu or writing each formula from scratch, you can describe the result you want and let Copilot assist with the steps.
Depending on your eligible subscription, Excel version, device, and organizational settings, Copilot can help you:
-
Generate and explain formulas.
-
Summarize tables and identify trends.
-
Create charts and PivotTables.
-
Highlight important values with conditional formatting.
-
Sort, filter, and organize data.
-
Modify worksheet layouts and cell values.
-
Build templates, reports, and planning tools.
-
Explore more advanced data analysis.
Microsoft Support+1
For example, imagine that you maintain a spreadsheet containing monthly sales figures for several products. Traditionally, you might calculate totals, compare months, identify your best-performing products, and create a chart yourself.
With Copilot, you could start by asking:
Analyze monthly sales by product, identify the three strongest performers, compare this month with last month, and suggest a suitable chart.
Copilot can help you work toward that result. You should still verify the calculations, check the relevant data, and confirm that the analysis supports your business decision.
The key idea: Copilot helps translate ordinary-language instructions into spreadsheet tasks, making many Excel workflows more accessible without eliminating the need for human review.
Why Should Beginners Use Copilot in Excel?
Learning Excel can take time, particularly when you are unfamiliar with formulas or need to work with large amounts of information. Copilot can make the learning process more approachable by letting you ask questions in plain English.
1. Save time on repetitive spreadsheet tasks
Routine activities such as summarizing expenses, categorizing information, applying formatting, and creating reports can consume valuable time. Copilot can assist with these tasks when the required capabilities are available in your Excel environment.
For example, you might ask it to organize a monthly expense table, highlight unusually high costs, or prepare a summary of sales by region.
2. Understand formulas without memorizing syntax
Excel formulas can look intimidating when you are starting out. Copilot can suggest formulas based on a description of your goal and explain what an existing formula does.
You can ask:
-
“Write a formula to calculate the total of cells B2 through B20.”
-
“Explain how this IF formula works.”
-
“Calculate the percentage change between the previous month and the current month.”
-
“Help me find why this formula returns an error.”
These interactions can help you learn while completing practical tasks.
3. Discover useful patterns in your data
A spreadsheet may contain hundreds or thousands of rows, making important patterns difficult to spot manually. Copilot can help explore trends, compare categories, identify outliers, and summarize findings.
For example, a retailer could ask which product categories generated the most revenue or which months showed the largest changes in sales.
4. Create charts and reports more easily
Visual reports help readers understand data quickly. Depending on the task and available features, Copilot can assist with creating charts, PivotTables, and summaries that you can review and refine.
5. Improve your Excel learning experience
Instead of treating Excel as a collection of complicated commands, you can learn by asking targeted questions about your own workbook. This makes it easier to understand why a particular formula, chart, or analysis is useful.
Copilot is an assistant, not a guarantee of correct results. Always check its suggestions before relying on them.
What Do You Need Before Using Copilot in Excel?
Before starting, check that your account and workbook are ready.
Check your Microsoft 365 subscription
Copilot availability depends on your subscription and the type of access provided to your account. Microsoft lists eligible Microsoft 365 consumer plans with applicable AI access, commercial Copilot subscriptions, and certain eligible business or enterprise subscriptions among the available access routes. Exact entitlements can change.
If you cannot see Copilot, check your account’s licensing information and your organization’s settings.
Prepare your spreadsheet data
Copilot generally works better when the information is clearly organized.
Before using it:
-
Give every column a descriptive heading.
-
Keep one type of information in each column.
-
Use consistent date, number, and currency formats.
-
Remove unnecessary blank rows and columns within the dataset.
-
Check for duplicate records and missing values.
-
Ensure totals and source figures are accurate.
For example, a sales worksheet might contain the columns Date, Product, Region, Units Sold, and Revenue.
This structure gives you a clearer foundation for asking questions about sales performance.
Save and protect your workbook
Some Copilot experiences require a supported file configuration or storage location. Follow the requirements displayed in your version of Excel.
Before asking Copilot to make changes, save a working copy of important data. Avoid uploading confidential customer records, passwords, payment details, or other sensitive information unless your organization’s policies explicitly permit the intended use.
How to Use Copilot in Excel Step by Step

Follow these steps to begin using Copilot.
Step 1: Open Microsoft Excel
Launch Excel on your supported desktop application or through Excel for the web. Open an existing workbook or create a new spreadsheet.
If you are practicing, start with a small sample dataset rather than an important business file.
Step 2: Find the Copilot button
Look for the Copilot icon in the Excel interface. Its position may vary by version, platform, and rollout.
Select the icon to open the Copilot experience.
If it is missing, verify your subscription, application version, network access, privacy settings, and organization-level permissions. Microsoft provides a troubleshooting guide for users who believe they should have access.
Step 3: Understand the available modes
Some current Excel experiences offer three modes:
-
Edit mode: Allows Copilot to make supported changes directly to your workbook.
-
Plan mode: Helps develop a structured plan for a more involved task before execution.
-
Chat mode: Keeps responses in the conversation so you can ask questions and analyze information without directly editing the workbook through that mode.
The available modes vary by device and account. Windows, Mac, and the web support edit, plan, and chat modes, while mobile availability differs.
For your first attempt, use chat or plan mode if available and explore the suggested approach before making changes.
Step 4: Write a clear prompt
A prompt is the instruction you give Copilot.
Instead of writing:
“Sales report.”
Try:
“Summarize total revenue by region, identify the region with the highest revenue, and explain any major differences in performance.”
The second instruction gives Copilot a specific goal and tells it what information matters.
Step 5: Review the response
Read the explanation and inspect any formulas, tables, charts, or workbook changes Copilot produces.
Ask yourself:
-
Did it use the correct columns?
-
Are the figures consistent with the original data?
-
Are percentages and totals calculated correctly?
-
Does the chart communicate the intended message?
-
Were any assumptions made that need clarification?
Step 6: Refine the result
If the first answer is not quite right, continue with a follow-up prompt.
For example:
“Break the regional results down by product category and display the results in descending order of revenue.”
You can progressively improve the output instead of trying to describe every detail in your first request.
Step 7: Save the final workbook
Once you have checked the results, save the workbook and document any important assumptions. If the file will be shared, confirm that the changes are appropriate for everyone who has access.
Microsoft notes that saved Copilot edits can be visible to other people who have access to a shared workbook, so review changes carefully before collaborating.
How to Write Better Copilot Prompts in Excel
The quality of your instructions has a major influence on how useful the results will be.
Use a goal, context, and output format
A practical prompt structure is:
Task + data context + desired result + constraints.
For example:
“Analyze the revenue column in my sales table, compare revenue by region for the current quarter, and summarize the three largest differences in a table. Use the existing data only.”
This instruction specifies the task, context, output, and a useful boundary.
Use these beginner-friendly prompt examples
FORMULAS
Calculate total revenue
“Create a formula that multiplies units sold by unit price for each row. Explain the formula and apply it to the relevant records.”
Copy prompt
DATA ANALYSIS
Find the best-performing region
“Compare total revenue across all regions, rank them from highest to lowest, and summarize the main differences.”
Copy prompt
VISUALIZATION
Create a useful chart
“Create a chart comparing monthly revenue. Use a suitable chart type, label the axes clearly, and make the monthly trend easy to understand.”
Copy prompt
DATA QUALITY
Review inconsistent records
“Inspect this table for missing values, duplicate records, inconsistent date formats, and unusual entries. List the issues and recommend corrections before changing the data.”
Copy prompt
Microsoft also recommends asking specific questions and using follow-up prompts to refine analysis.
How to Use Copilot in Excel to Create Formulas
Formulas are among the most useful starting points for beginners.
Suppose your worksheet contains these columns:
| Product | Units Sold | Unit Price |
|---|---|---|
| Notebook | 12 | $5 |
| Pen | 25 | $2 |
| Folder | 10 | $4 |
You want to calculate revenue for each product.
Ask Copilot:
“Create a Revenue column by multiplying Units Sold by Unit Price for every row.”
Copilot may suggest a formula such as:
=B2*C2If column B contains units sold and column C contains unit price, this formula multiplies those two values. The formula can then be applied to the remaining rows using the appropriate Excel workflow.
Ask Copilot to explain an existing formula
Suppose you encounter:
=IF(D2>=1000,"Target Met","Below Target")You can ask Copilot to explain it in simple language.
The formula checks whether the value in cell D2 is at least 1,000. If the condition is true, it returns “Target Met”; otherwise, it returns “Below Target.”
This is an effective way to learn formulas while working on real spreadsheet tasks.
Important formula checks
Even if Copilot provides a plausible formula, verify the cell references, ranges, assumptions, and expected results. Test it against a few manually calculated examples before applying it to a large dataset.
How to Analyze Data With Copilot in Excel

Data analysis becomes more approachable when you can ask questions instead of manually exploring every row.
Microsoft’s documentation describes supported analysis tasks such as comparisons, summary statistics, trend exploration, outlier identification, and answering questions about structured data.
Analyze sales performance
Try asking:
“Compare monthly revenue by product and identify which products increased or decreased the most.”
Copilot can help summarize the relevant information and highlight patterns worth investigating.
Summarize expenses
For an expense table, try:
“Group expenses by category, calculate the total for each category, and identify the three largest categories by spending.”
Review the categories carefully, especially when expense descriptions are inconsistent or ambiguous.
Identify unusual values
Ask:
“Find unusually high or low values in the revenue column and explain which records I should inspect.”
An unusual value is not necessarily an error. It might represent a legitimate large order, a seasonal event, or a data-entry mistake. Use the findings as a starting point for investigation.
Compare performance over time
You can ask:
“Compare this quarter with the previous quarter, calculate the percentage change, and summarize the main differences.”
Make sure the date ranges and comparison periods are correct. A partial quarter compared with a complete quarter may produce misleading conclusions.
Use advanced analysis when necessary
Some Excel Copilot experiences support advanced analysis using Python. This can help with more complex statistical analysis, simulations, and visualizations. Availability depends on your experience and account.
For beginners, start with a straightforward question and move to advanced analysis only when the problem requires it.
How to Create Charts and PivotTables With Copilot
Charts and PivotTables can turn a long spreadsheet into a report that is easier to understand.
Create a chart from your data
Suppose you have monthly revenue figures for an entire year. You want to show whether revenue is increasing, decreasing, or staying relatively stable.
Ask:
“Create a line chart showing monthly revenue over time. Include a descriptive title, label the axes, and keep the months in chronological order.”
Review the chart before using it in a presentation. Check the date sequence, axis labels, units, and any missing months.
Summarize information with a PivotTable
A PivotTable groups and summarizes information by categories. It is useful for analyzing sales by region, expenses by department, or orders by product.
Try this prompt:
“Summarize total revenue by region and product category using a PivotTable.”
If Copilot supports the requested operation in your environment, review the proposed fields and totals before accepting the result.
Build a simple dashboard
A dashboard combines important figures and visuals in one place. It can help managers and business owners monitor performance without reading an entire spreadsheet.
Ask Copilot:
“Help me create a sales dashboard with total revenue, total units sold, monthly revenue trends, and revenue by region. Use clear labels and explain the main findings.”
You may need to refine the layout, choose which metrics matter, and confirm that each chart references the correct data. A polished dashboard should communicate the important information without unnecessary visual clutter.
How to Use Copilot in Excel to Clean and Organize Data
Poorly organized data can make even a well-written prompt produce disappointing results. Cleaning your spreadsheet first can improve the quality of subsequent analysis.
Find duplicates and missing values
Ask Copilot to identify potential duplicate records and missing entries. Review the flagged rows before deleting or changing anything.
Two records with the same customer name might represent a duplicate, or they might belong to different people with identical names. Context matters.
Standardize dates and categories
A dataset may contain different formats for the same date or category. For example, one row might use “North Region,” while another uses “North.”
Try:
“Review the Region column for inconsistent naming. List the variations you find and suggest a consistent naming scheme without changing the original records.”
Once you approve the proposed corrections, apply them using a supported Excel workflow.
Improve spreadsheet formatting
Copilot may help apply consistent formatting, conditional formatting, data validation, borders, and worksheet layouts, depending on the available features.
You can ask:
“Format the sales table consistently, highlight revenue values above $5,000, and make the column headings easy to read.”
Check the threshold and currency units before accepting the formatting.
Practical Copilot in Excel Examples for Everyday Work
You do not need to be a data analyst to benefit from spreadsheet assistance. Here are several ways beginners can use Copilot in everyday situations.

1. Personal budgeting
Organize monthly expenses, summarize spending categories, compare planned and actual costs, and identify categories that deserve closer attention.
Example prompt: “Compare budgeted and actual expenses by category and calculate the difference.”

2. Inventory management
Summarize stock levels, compare inventory by product, and identify items that may require a manual stock review.
Example prompt: “List products with inventory below the reorder threshold shown in the table.”

3. Project tracking
Organize task lists, summarize completion status, and identify overdue tasks based on dates and status fields.
Example prompt: “Summarize tasks by status and list tasks past their due dates that are not marked complete.”

4. Student grade analysis
Calculate averages, compare subject scores, and visualize academic performance.
Example prompt: “Calculate the average score for each subject and create a chart comparing the results.”
These are examples of possible workflows, not guarantees that every prompt will execute automatically. Supported features, data structure, and account access affect the results.
Common Copilot in Excel Problems and How to Fix Them
Even with good prompts, you may occasionally encounter issues. Knowing what to check can help you resolve them.
Why is the Copilot button missing?
Possible reasons include an ineligible subscription, an outdated application, organization restrictions, network issues, or privacy settings.
What to do: Check the account signed into Excel, confirm your Microsoft 365 entitlement, update the application where appropriate, and consult your IT administrator if you use a managed work account. Microsoft’s official FAQ provides additional troubleshooting guidance.
Why does Copilot misunderstand my request?
Your prompt may be too broad, or the spreadsheet may contain ambiguous headings and inconsistent information.
What to do: Name the relevant columns, specify the date range, describe the expected output, and state any important constraints.
Instead of “Analyze sales,” try “Compare total revenue by region for the last three complete months and list the top five products.”
Why are the results inaccurate?
Copilot can misinterpret information or produce incorrect results. Microsoft explicitly warns users to review AI-generated results rather than assume they are accurate.
What to do: Check formulas, compare sample calculations against the original data, inspect filters and ranges, and ask Copilot to explain its reasoning or calculation approach where supported.
Why can Copilot not analyze my data?
The workbook may contain unstructured information, unsupported layouts, or data that is not available to the specific Copilot feature you are using.
For example, Microsoft’s direct-answer analysis experience works with structured tables or table-like ranges and does not support unstructured data in that workflow.
What to do: Organize your information into a clear table with headings, consistent data types, and a single record per row.
Why did Copilot change my worksheet?
If you use an editing mode, Copilot can make changes directly to your workbook.
What to do: Review the proposed plan where available, make a backup before important operations, inspect the changes, and use Undo or workbook version history when appropriate. Avoid accepting large changes without checking their impact.
Copilot in Excel Best Practices for Accurate Results
To get more dependable results, make these habits part of your spreadsheet routine.
-
Start with clean data. Check headings, dates, missing values, and duplicates.
-
Ask one clear question at a time. Break complex work into manageable steps.
-
Specify the expected output. State whether you want a summary, formula, chart, or ranked table.
-
Check calculations independently. Verify important totals, percentages, and formulas.
-
Use a copy for risky changes. Preserve the original version before making substantial edits.
-
Protect confidential information. Follow your organization’s privacy and data-handling rules.
-
Document assumptions. Record the reporting period, filters, and definitions used in an analysis.
-
Review before sharing. Ensure the workbook is accurate and appropriate for its audience.
These practices make Copilot more useful because they combine AI assistance with the structured thinking and quality checks that reliable spreadsheet work requires.
Is Copilot in Excel Worth Using for Beginners?
For many beginners, Copilot is worth exploring because it reduces the need to memorize every Excel command before starting a task.
Its greatest value is not simply generating a formula or chart. It can help users move from a question to a structured analysis, learn what spreadsheet operations mean, and improve a report through follow-up instructions.
However, it is not a replacement for learning basic Excel concepts. Understanding rows, columns, formulas, filters, data types, and charts will help you identify mistakes and write more effective prompts.
If you work with spreadsheets regularly, begin with one repetitive task, such as summarizing monthly expenses or comparing sales figures. Evaluate the result, learn from the process, and gradually expand your use of Copilot.
Frequently Asked Questions About Copilot in Excel
1. How do I use Copilot in Excel for the first time?
Open Excel, sign in with an eligible Microsoft account, open your workbook, and select the Copilot icon if available. Enter a clear natural-language prompt, review the response, and verify the results before using them.
2. Can Copilot in Excel create formulas automatically?
Yes. Copilot can help generate formulas from descriptions of the calculations you want to perform. Depending on the available feature, it may also help apply formulas to your workbook. Always verify cell references and test the result.
3. Can I use Copilot in Excel without knowing formulas?
Yes. You can describe many tasks in ordinary language without knowing the exact formula syntax. However, understanding basic formulas helps you check the accuracy of Copilot’s suggestions.
4. Can Copilot analyze large Excel datasets?
Copilot can assist with structured data analysis, but supported dataset sizes and capabilities depend on the feature and your environment. Organize your data into clearly labeled tables and check the applicable limits before working with large files.
5. Can Copilot create charts and PivotTables?
Yes. Supported Copilot experiences can help create charts and PivotTables from spreadsheet data. Review the selected data, categories, labels, and calculations to make sure the output communicates the correct information.
6. Is Copilot in Excel free?
Access depends on your Microsoft account, subscription, applicable AI entitlements, and organizational settings. Some Microsoft 365 plans include eligible AI access, while other users may need a different subscription or license. Check Microsoft’s current eligibility information before purchasing anything.
7. Does Copilot in Excel work on Mac and online?
Yes. Microsoft documents Copilot availability in Excel for Windows, Mac, and the web, along with supported mobile experiences. The available modes and capabilities differ by platform and may change as features roll out.
8. Can Copilot make mistakes in Excel?
Yes. AI-generated results can contain errors or reflect a misunderstanding of the request or underlying data. Check calculations, formulas, assumptions, and any workbook changes before relying on the output.
9. Can Copilot explain an existing Excel formula?
Yes. You can ask Copilot to explain a formula in plain language and describe what its components do. This can help beginners understand unfamiliar formulas and troubleshoot spreadsheet problems.
10. Is Copilot suitable for business reports?
It can assist with preparing summaries, charts, comparisons, and other reporting elements. Business-critical reports still require verification of source data, calculations, definitions, and conclusions before distribution.
What Do US Customers Say About Copilot in Excel?
People who use AI spreadsheet tools may value the ability to describe tasks in natural language, explore data more easily, and get help with unfamiliar formulas. These are potential benefits of the workflow, not proof that every user will experience the same results.
For trustworthy publishing, do not present invented testimonials as verified US customer reviews. No independently verified US customer-review records have been established for this article.
If you want to include genuine customer feedback in a published version, use reviews collected from identifiable, legitimate sources and preserve their original meaning. Where relevant, disclose incentives or other material connections and obtain permission when required.
You can also include an editorial feedback section that invites readers to share their own experience with Copilot in Excel.
Data-Backed Takeaway: What the Official Documentation Confirms
Microsoft’s official documentation identifies three primary Copilot modes in Excel—edit, plan, and chat—for supported Windows, Mac, and web experiences. Each mode serves a different purpose: editing workbooks, planning tasks before execution, or discussing and analyzing data through chat. Availability varies by platform and account.
This is a verifiable, source-backed statement rather than an unsupported claim about productivity improvements. No specific percentage of time saved or accuracy improvement is claimed here because such a figure would require appropriate supporting evidence.
Final Thoughts: Make Excel Easier With Copilot
Learning how to use Copilot in Excel can help you approach spreadsheets with greater confidence. From generating formulas and organizing data to building charts and exploring business trends, its natural-language interface can make many tasks more approachable for beginners.
The best results come from combining clear prompts with organized data and careful verification. Start with a small task, review the output, and build your skills as you become more comfortable with the tool.
Read the complete guide, practice with your own sample spreadsheet, and discover how AI-assisted Excel workflows can help you organize information, understand your data, and prepare clearer reports.
Ready to get started? Open Excel, try your first Copilot prompt, and turn one repetitive spreadsheet task into an opportunity to work smarter.
SEO Publishing Details
SEO TITLE
How to Use Copilot in Excel: Beginner’s Guide
META DESCRIPTION
Learn how to use Copilot in Excel to generate formulas, analyze data, create charts, and simplify spreadsheet tasks with this beginner-friendly guide.
PERMALINK / SLUG
how-to-use-copilot-in-excel-complete-guide
PRIMARY KEYWORD
how to use Copilot in Excel
SECONDARY KEYWORDS
Copilot in Excel tutorial, Microsoft Excel AI, Excel Copilot formulas, Excel data analysis, Copilot Excel prompts, AI spreadsheet tools, Excel charts with Copilot
REQUIRED CONTENT PHRASE
Read the Complete Guide
TAGS
Microsoft Excel, Copilot in Excel, AI Tools, Excel Tutorial, Data Analysis, Productivity Tips, Microsoft 365
Official Resources
-
Copilot in Excel: Frequently asked questions
-
Get direct answers to your data analysis questions
Editorial note: This article concerns software productivity, not health or medical advice. Health-related disclaimers are not applicable. Software features and subscription requirements may change; consult Microsoft’s official documentation for the latest details.